Multiclass Confusion Matrix
Learn how to use the Confusion Matrix to find false negative predictions
The heart of Tenyks platform is the Data Explorer, here you can find some of the most powerful features to understand your data.
One these tools is the Multiclass Confusion Matrix for Object Detection, a grid that orders your model predictions in four categories: true positive, undetected, misprediction and ghost prediction.
What can I use this matrix for?This matrix excels when you are tasked to answer questions such as:
- How many examples of Class A did the model confuse with Class B?
- How many undetected predictions were there (e.g. due to non-representative or rare samples)?
- How many examples don’t have any corresponding annotation (i.e. ghost predictions 👻)?
🚙 Imagine you work in the autonomous vehicles industry, here we show you how you can use it to find undetected predictions of pedestrians crossing the street at night.
1. Open the Data Explorer
Select the bdd_2000 dataset and one of its models. Then, click on Data Explorer, located on the left bar (Figure 1).
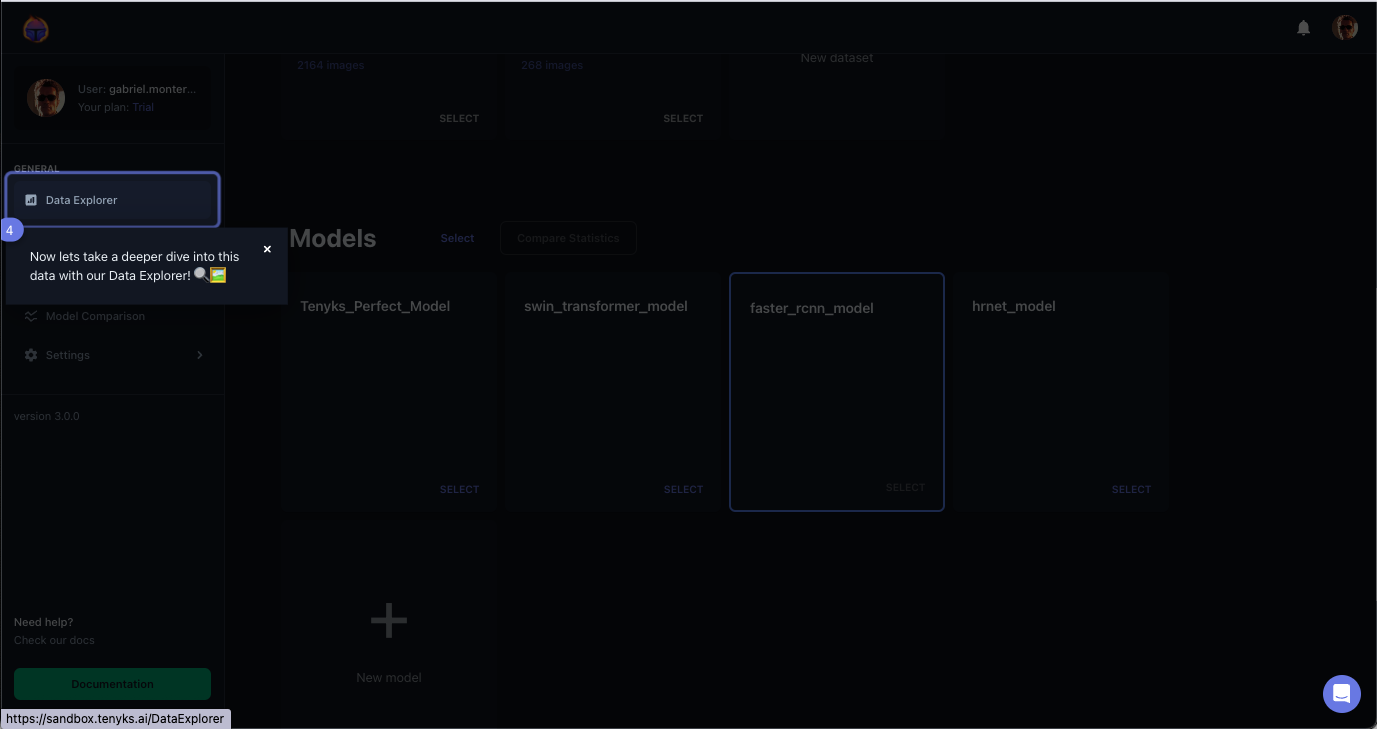
Figure 1. Selecting the Data Explorer in the Tenyks platform
2. Launch the graphs
Once in the Data Explorer, click on the Show Graphs button located on the right of the screen, see Figure 2.
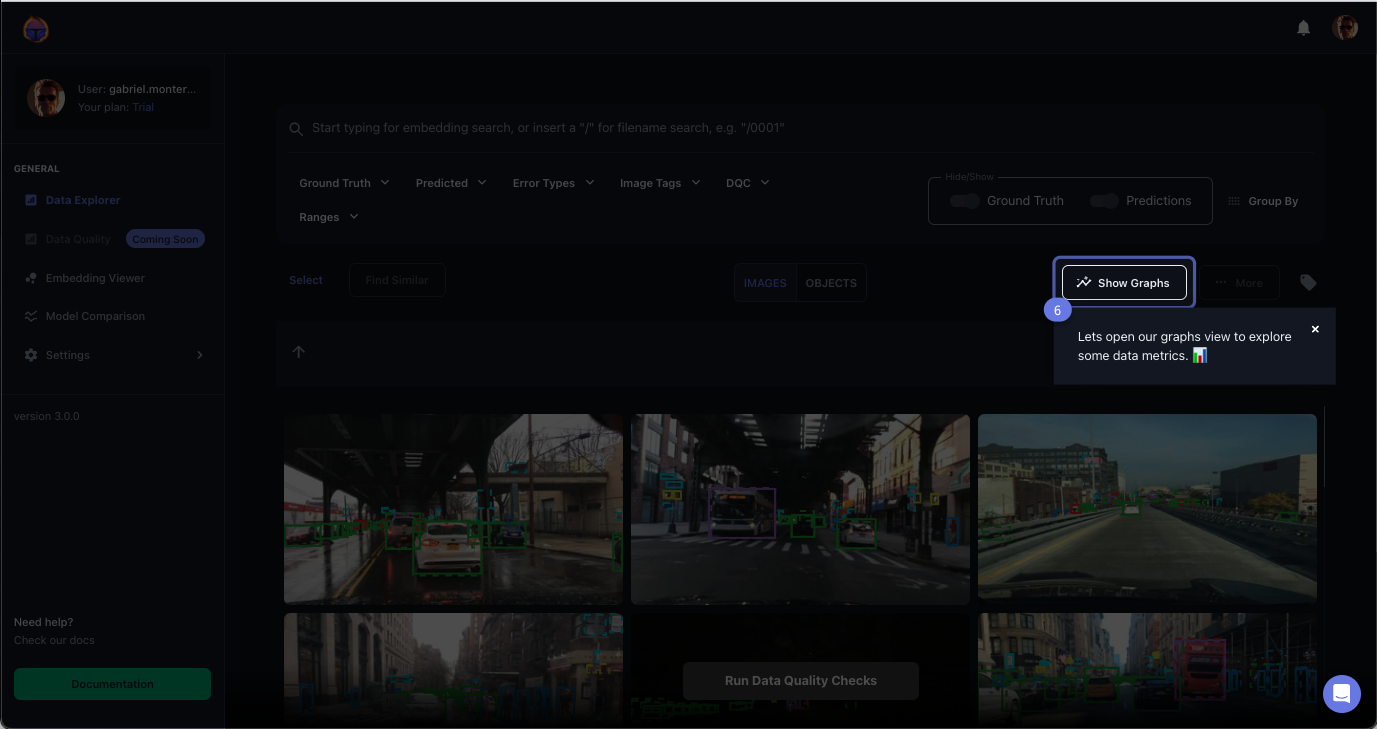
Figure 2. Clicking on the Show Graphs button opens up the Confusion Matrix
3. Find the undetected predictions for the Pedestrian class
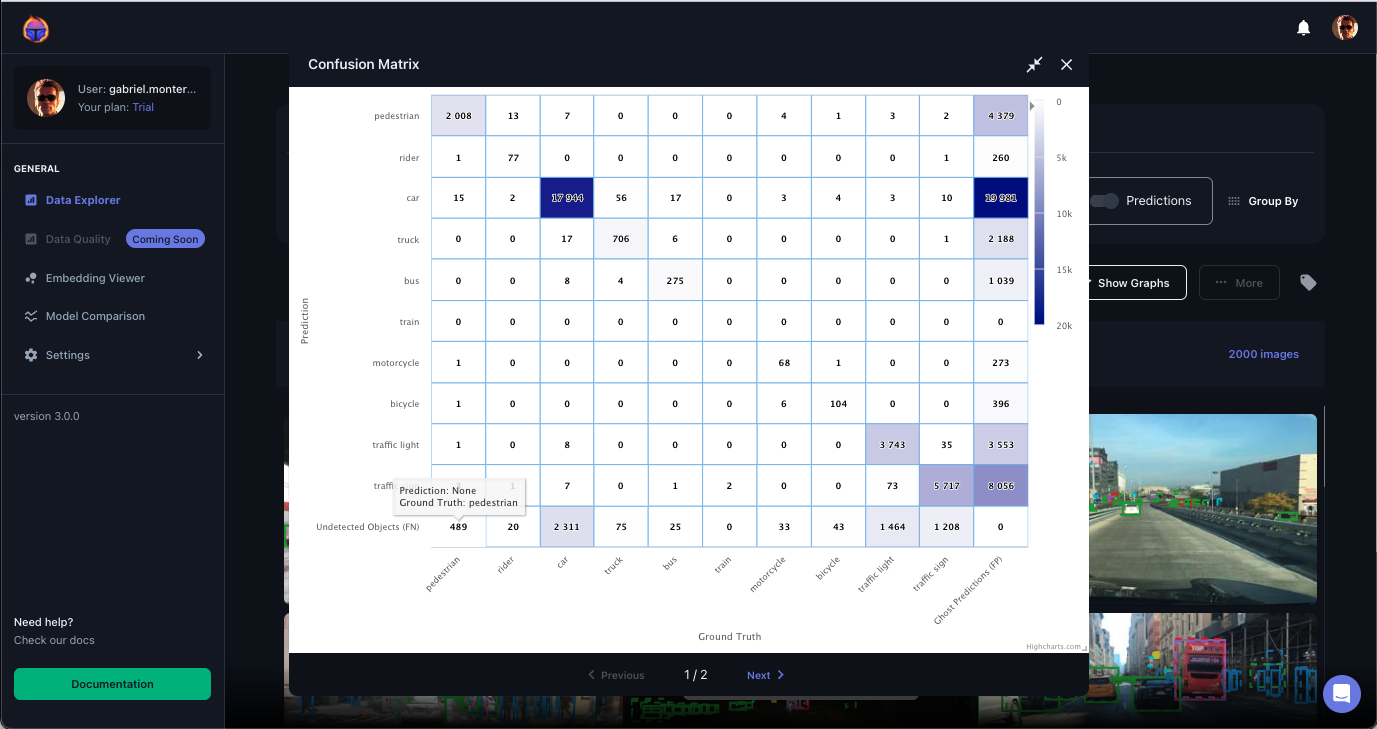
Once the matrix has loaded, Figure 3, the bottom row contains the undetected objects for every class. You will notice classes with minor problems such as train or raider. However, others like pedestrian, traffic light or car aren't being detected by the model (i.e. false negative predictions).
To see where our model is not detecting pedestrians, click on the square representing the intersection between undetected objects and pedestrian class (i.e. where the number 489 is displayed).
4. Explore the data
The Data Explorer will magically show you all the 489 images with undetected pedestrians!
In seconds you can have all this information at your fingertips, for any custom dataset previously uploaded on the Tenyks platform! 😀
Updated about 1 year ago