Data Exploration with the Embedding Viewer
Learn how to quickly get an overview of the dataset with the Embedding Viewer 🌟🔍
Pre-requisite😀 If you haven't previously downloaded the BDD dataset, you can do it here
In this walkthrough we show how to use the Embedding Viewer: a tool to visualize and analyze the vector embeddings in your dataset, see Figure 1.
Vector embeddings are the representations of data stored and analyzed in vector databases. These vectors place semantically similar items close together in space, and dissimilar items far apart.
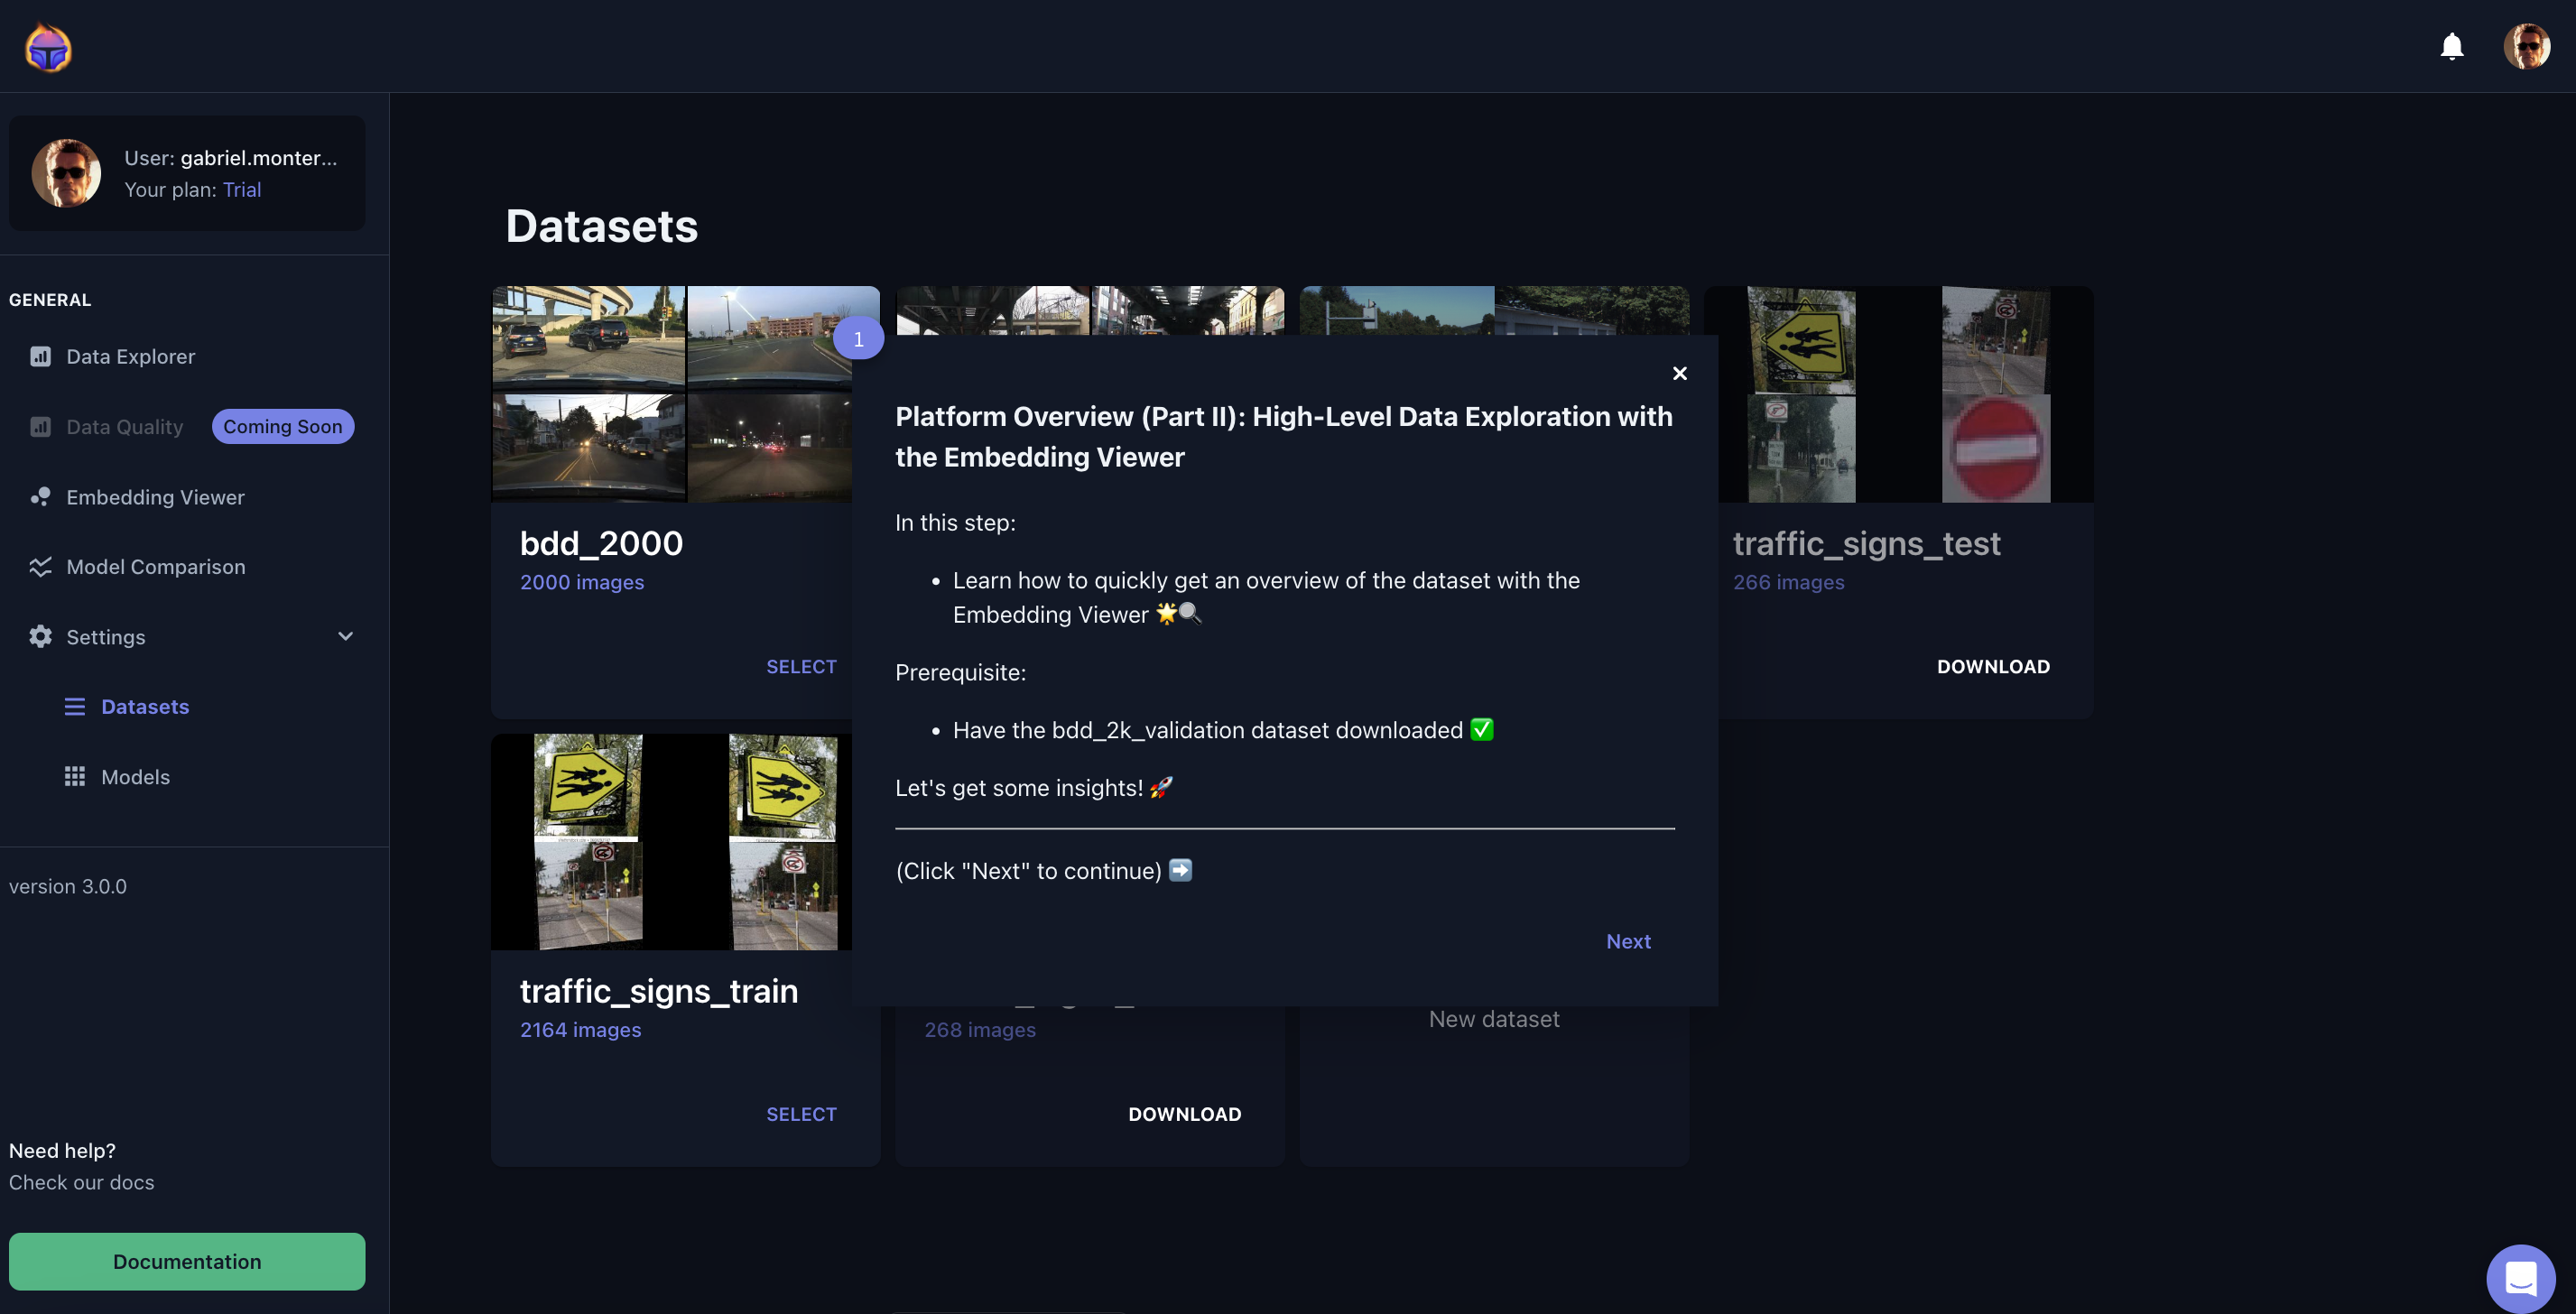
Figure 1. This short walkthrough shows you how to use the Embedding Viewer
1. Select a dataset
When you first visit the Tenyks dashboard, you will see a number of pre-uploaded datasets. To use them, you first need to click on the Download button. Once a dataset was downloaded, you can now select it (Figure 2).
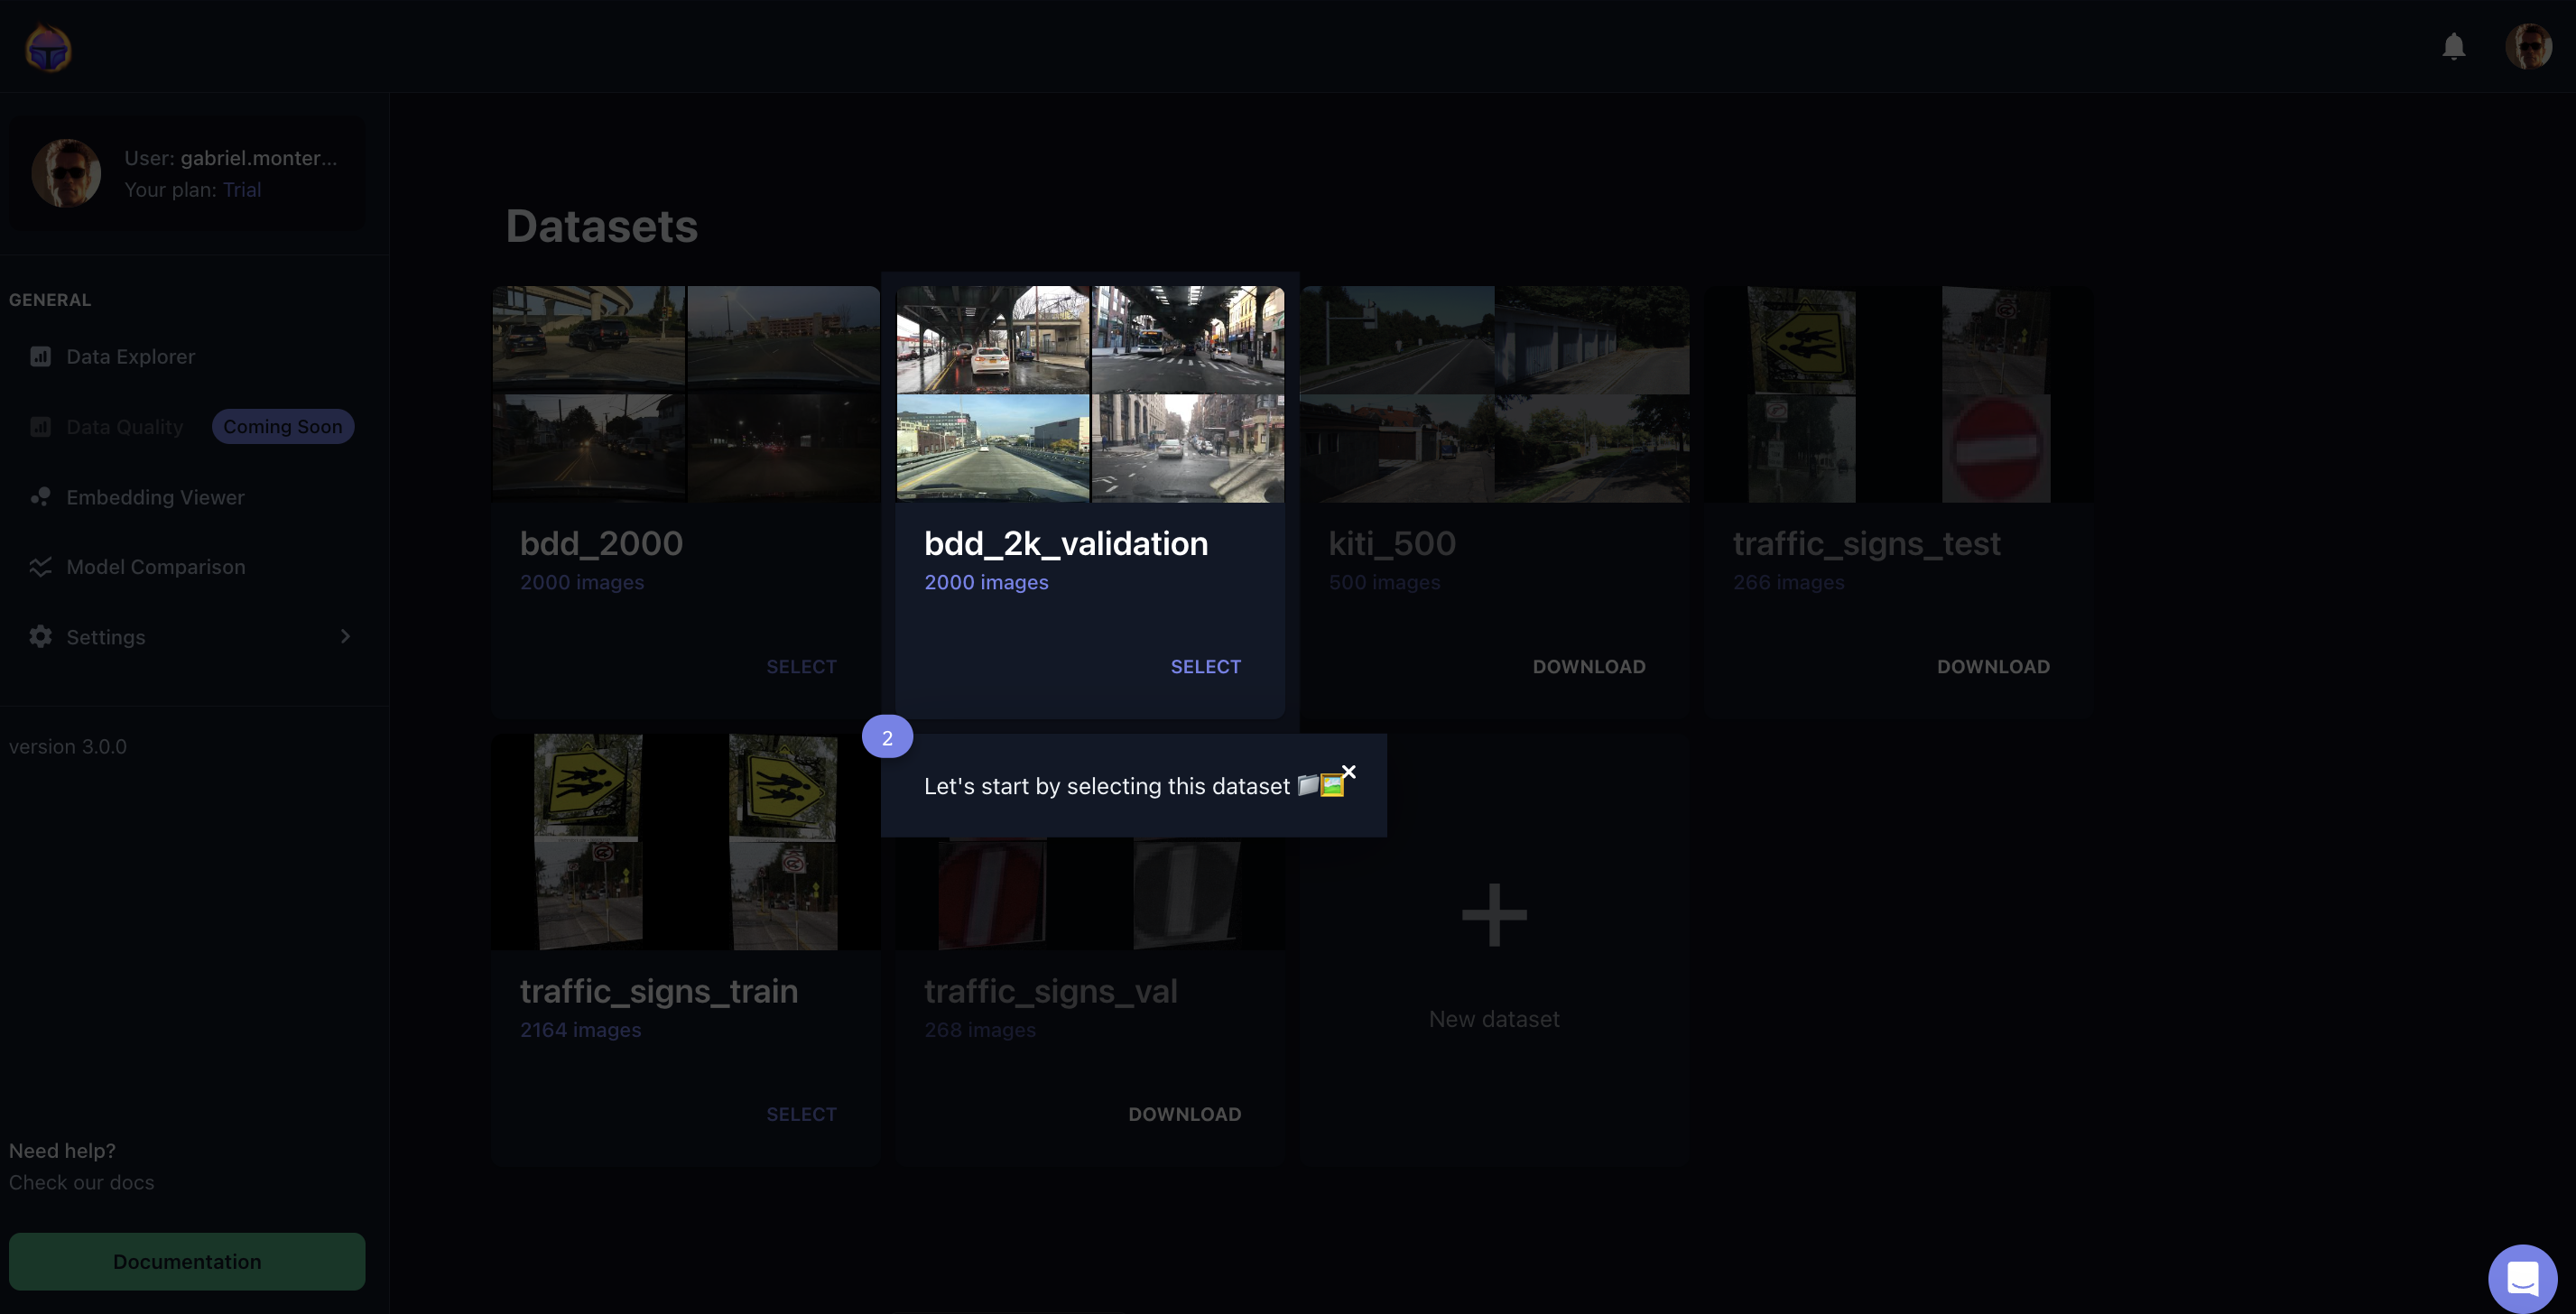
Figure 2. Selecting a dataset: simply click on any downloaded dataset
The first step is to Select a Dataset, then Select a Model, and finally click on the Embedding Viewer feature located on the left side of your Tenyks dashboard, see Figure 2.
2. Select a model
Once you selected a dataset, select one of the models corresponding this dataset (Figure 3).
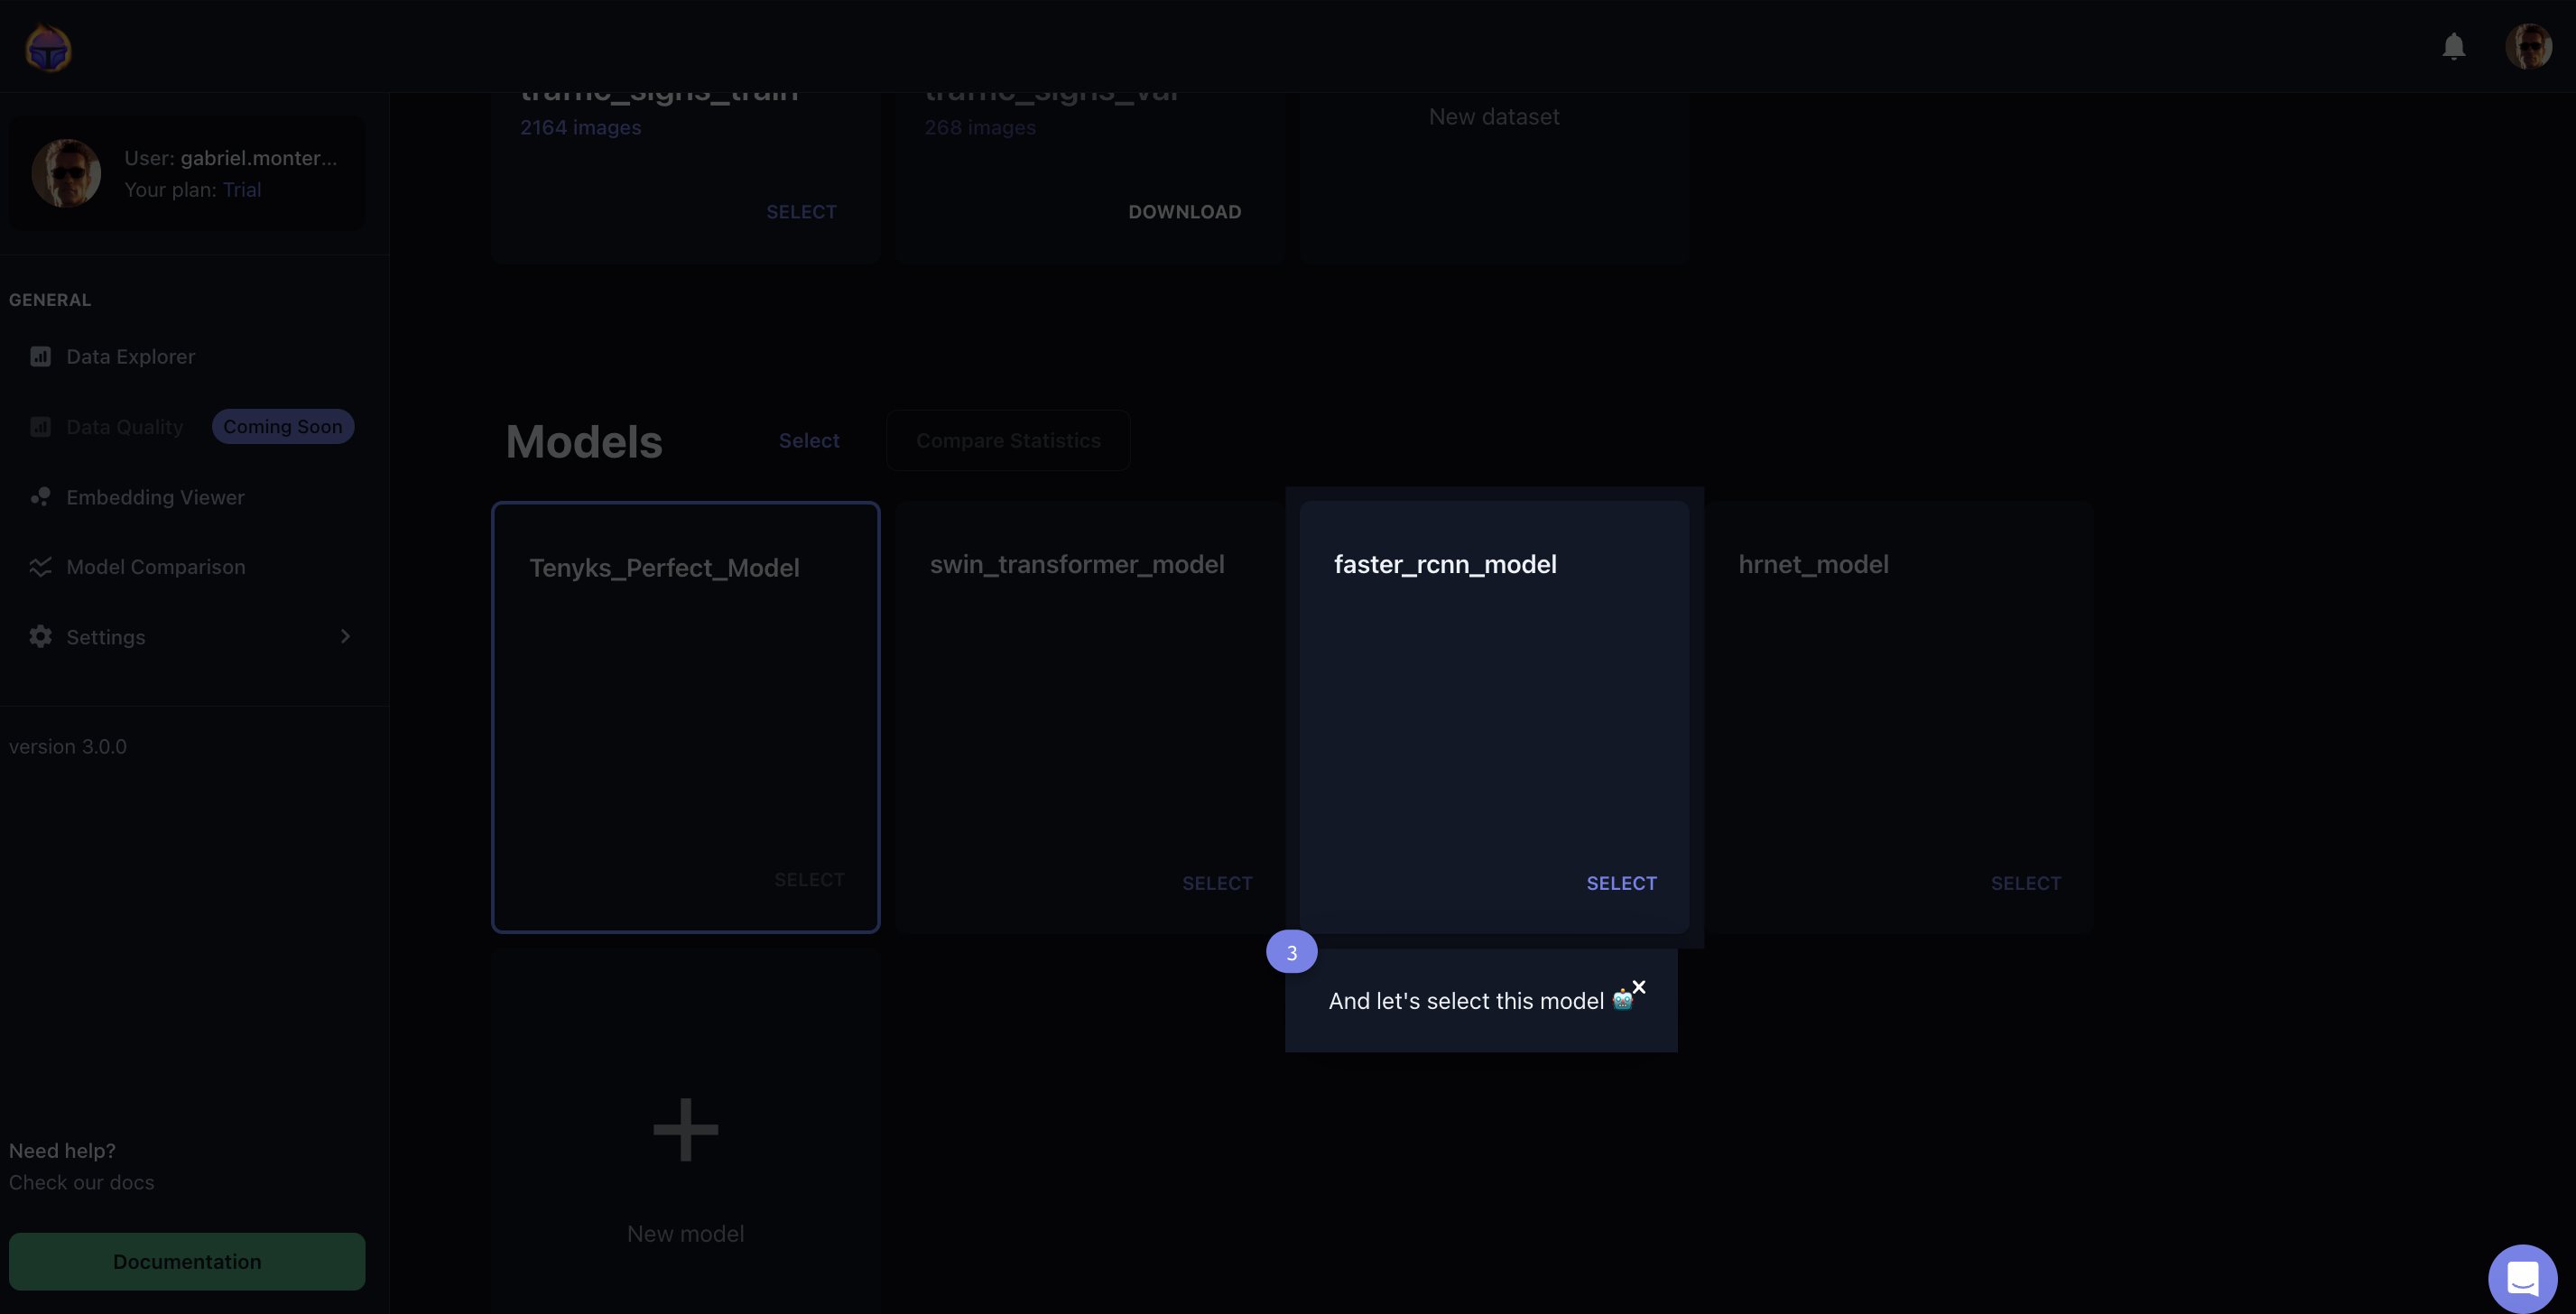
Figure 3. Here we are selecting a Faster RCNN model
3. Open the Embedding Viewer
On the menu of the left side of your Tenyks dashboard, click on the Embedding Viewer.
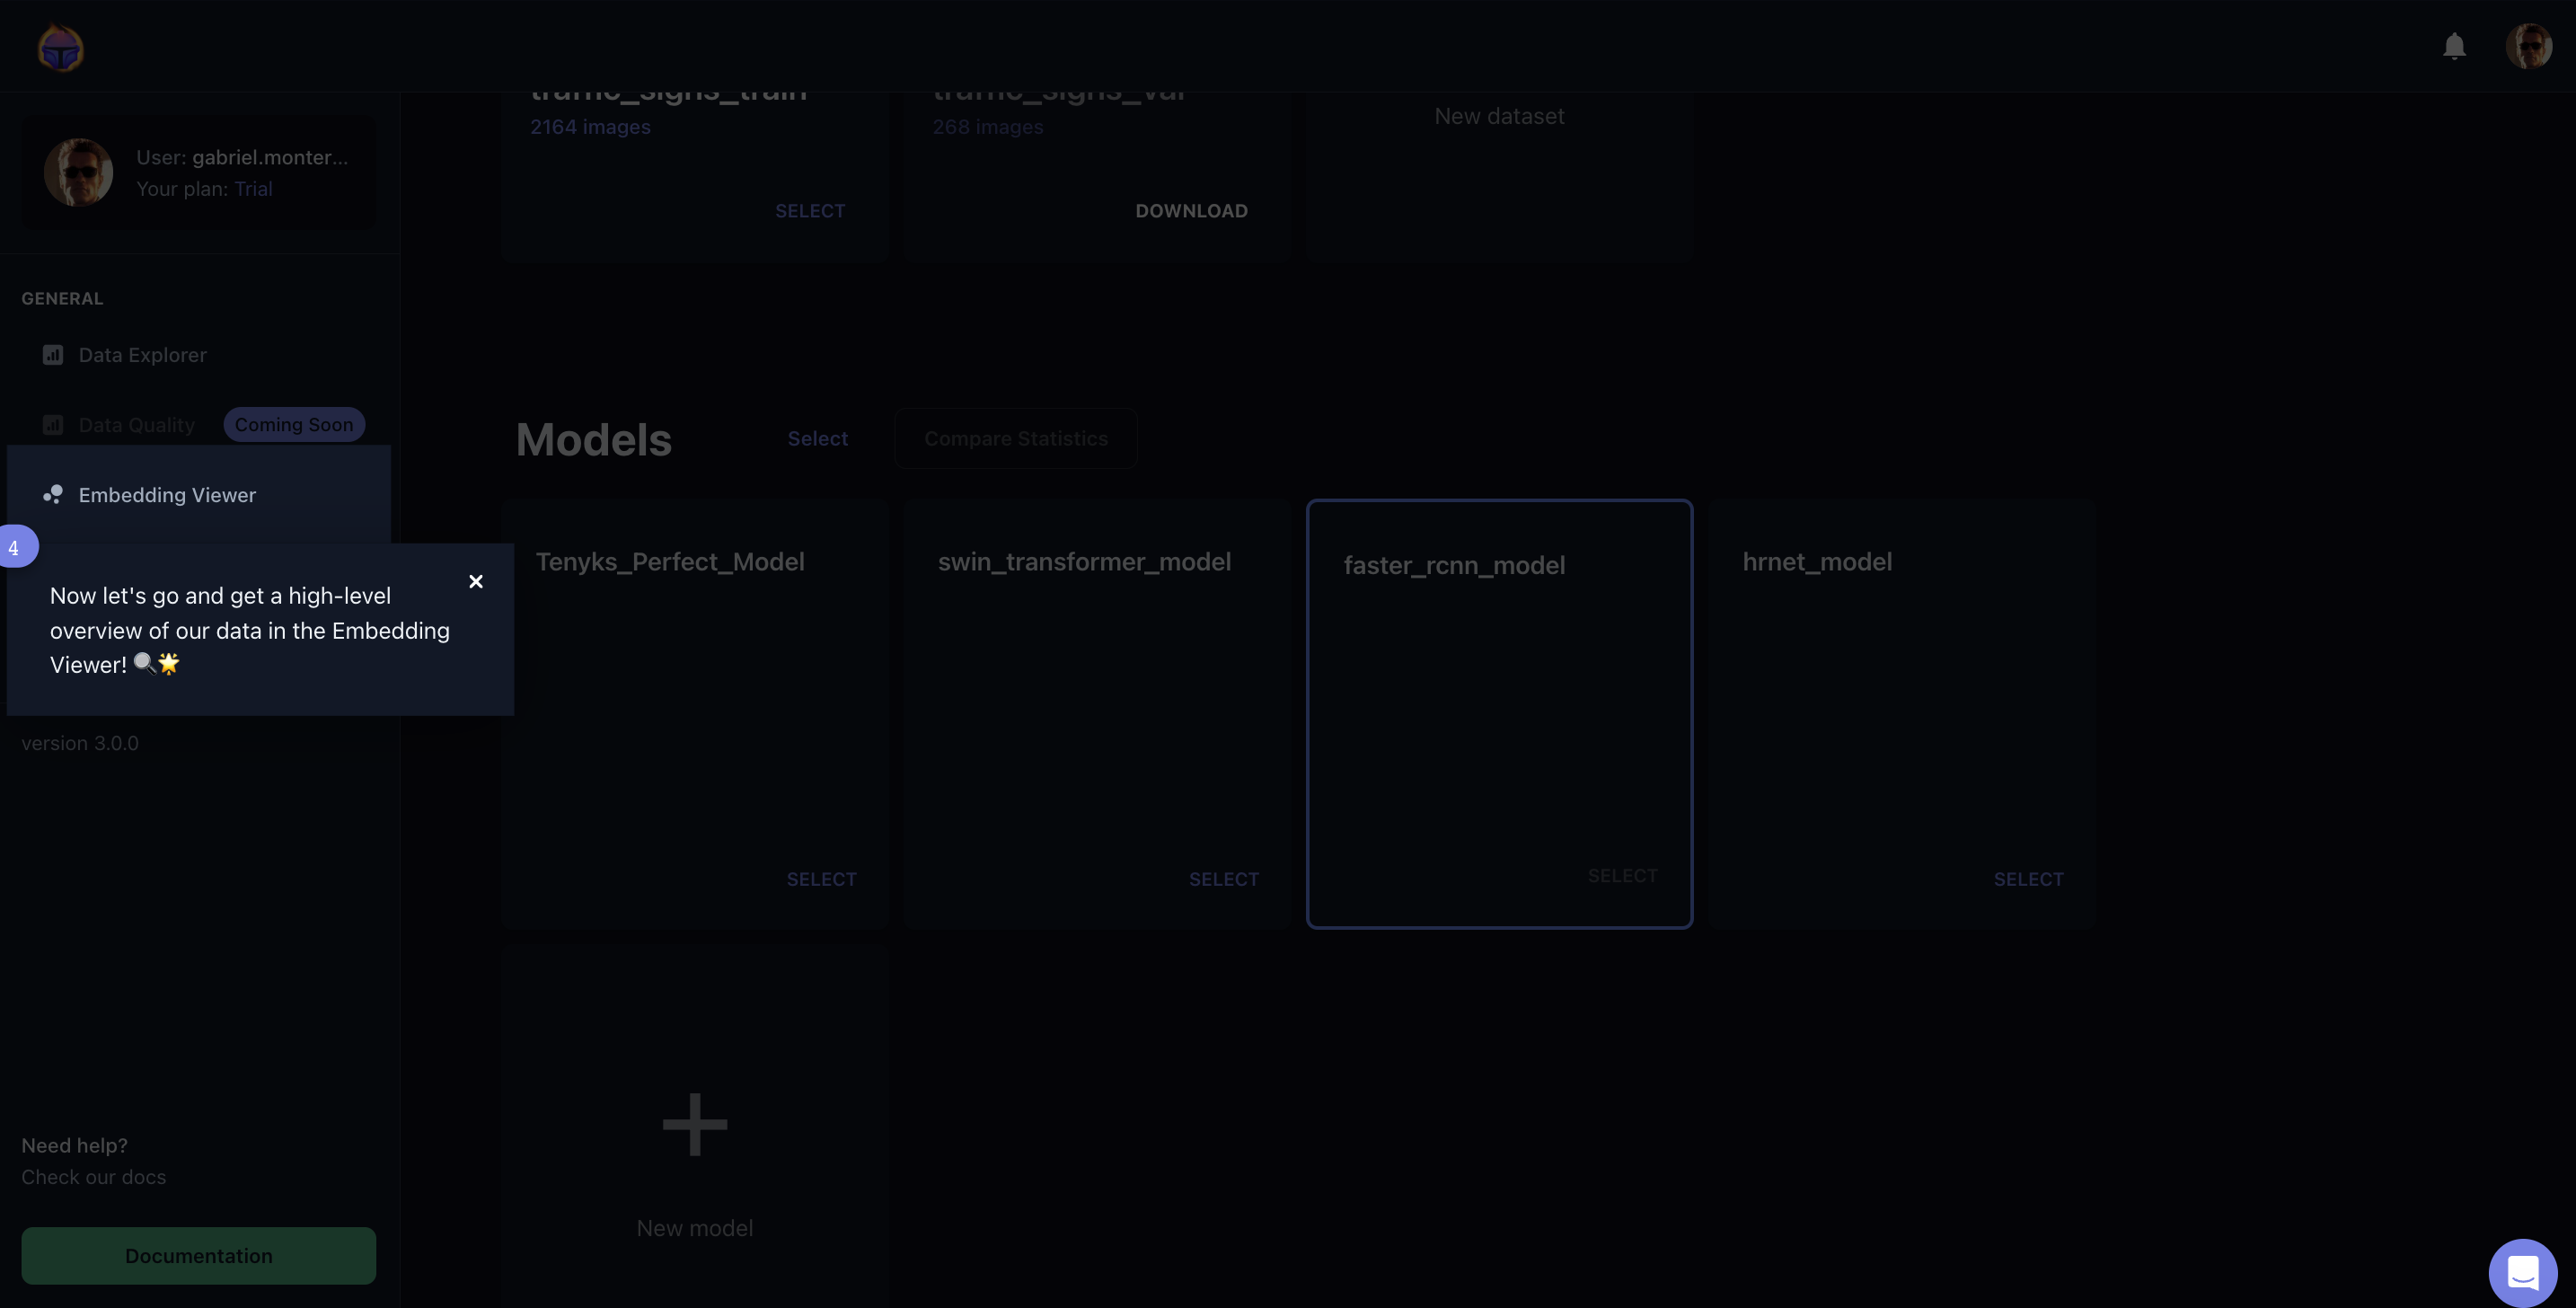
Figure 4. Opening the Embedding Viewer
Voila! The next screen shows a map of your data represented by vector embeddings. By default, a t-SNE embedding view is shown, see Figure 5.
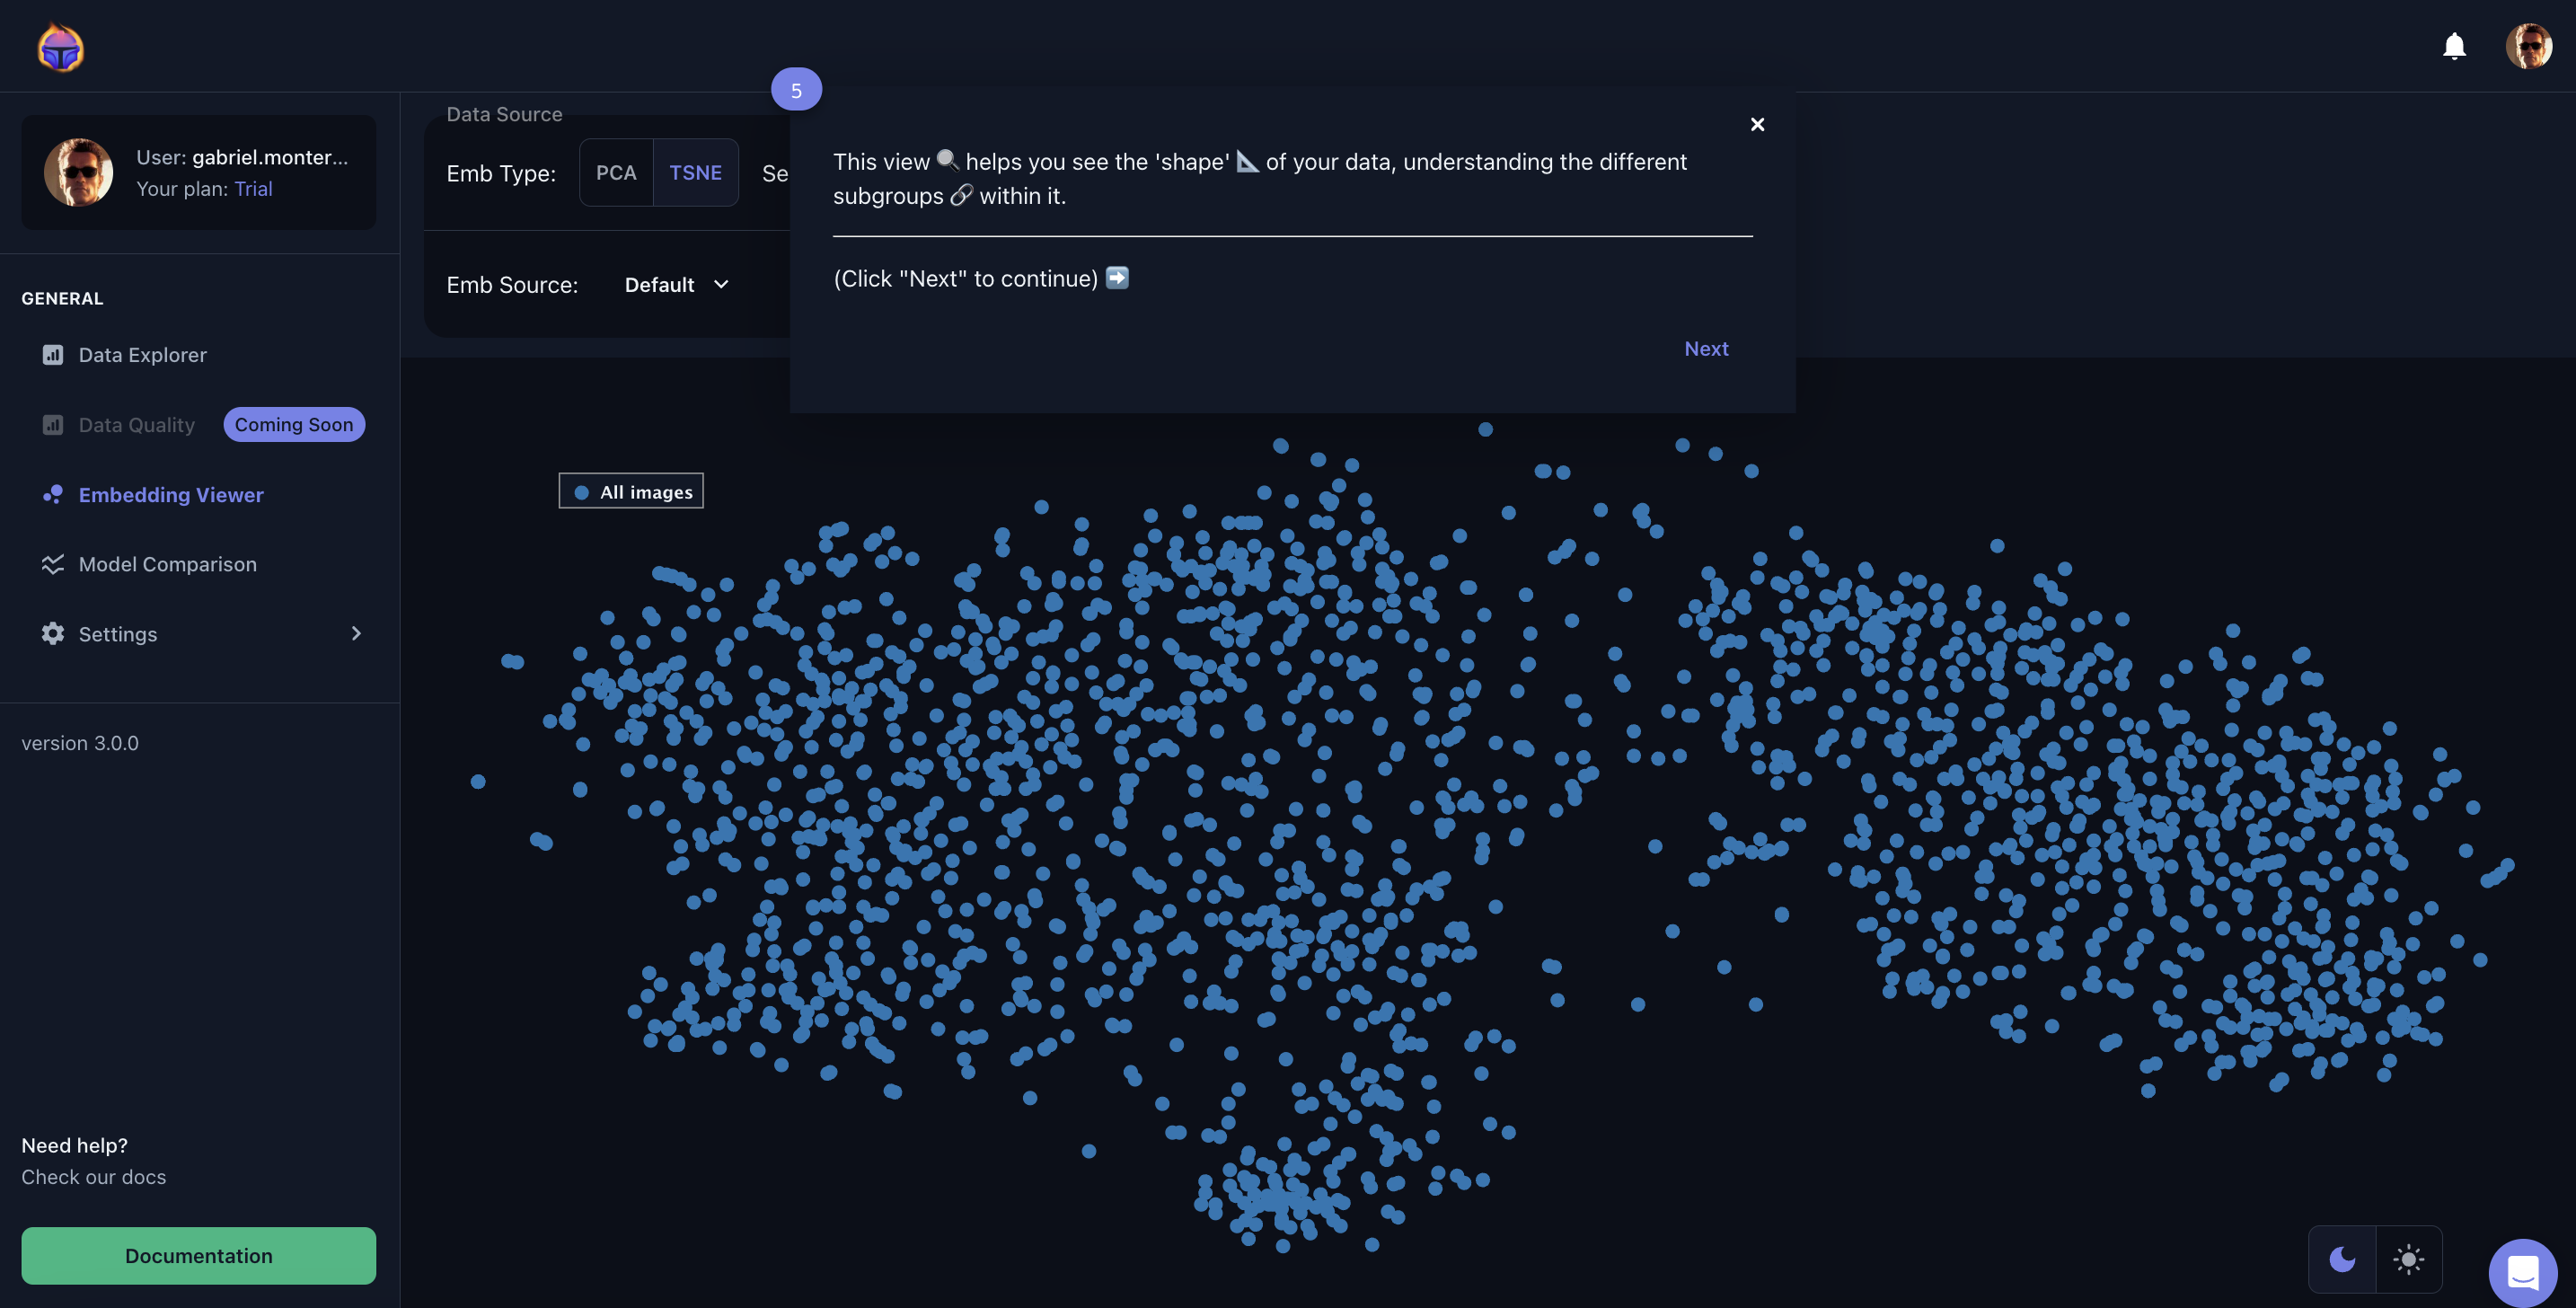
Figure 5. The Embedding Viewer in action
What is t-SNE?📚 t-SNE stands for t-Distributed Stochastic Neighbor Embedding, a machine learning algorithm that reduces the dimensionality of high-dimensional data while preserving the pairwise similarity relationships between data points.
In other words: a t-SNE embedding viewer lets you select data points, and highlight clusters or patterns in the data. This tool is valuable for gaining insights into the structure and relationships within high-dimensional datasets, especially when it's difficult to interpret the data in its original form.
🔍 Finally, you can also choose to see the map with images rather than points, as shown in Figure 6.
Figure 6. The Embedding Viewer showing images of the BDD dataset
Updated 6 months ago